2. Charts
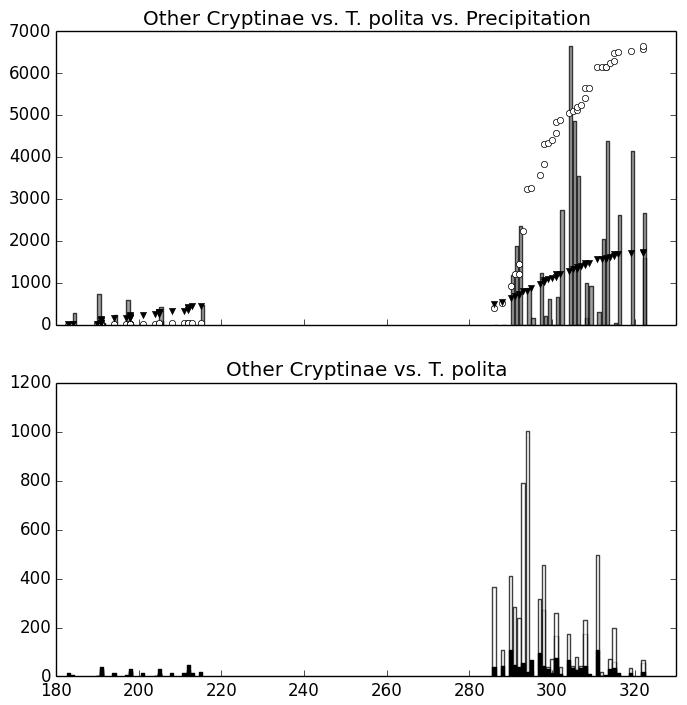
Figure A. Top: cumulative number of specimens of T. polita (white circles) vs. other Cryptinae (black triangles) against the cumulative precipitation (gray bars, normalized), at the end of each sampling event (3 traps x 3 areas x 1 week), along the year (X-axis, same as in the bottom plot). Bottom: total number of specimens of T. polita (white bars) vs. other Cryptinae (black) along the year (X-axis = day number of year). Combined data for all years (2000-2008).
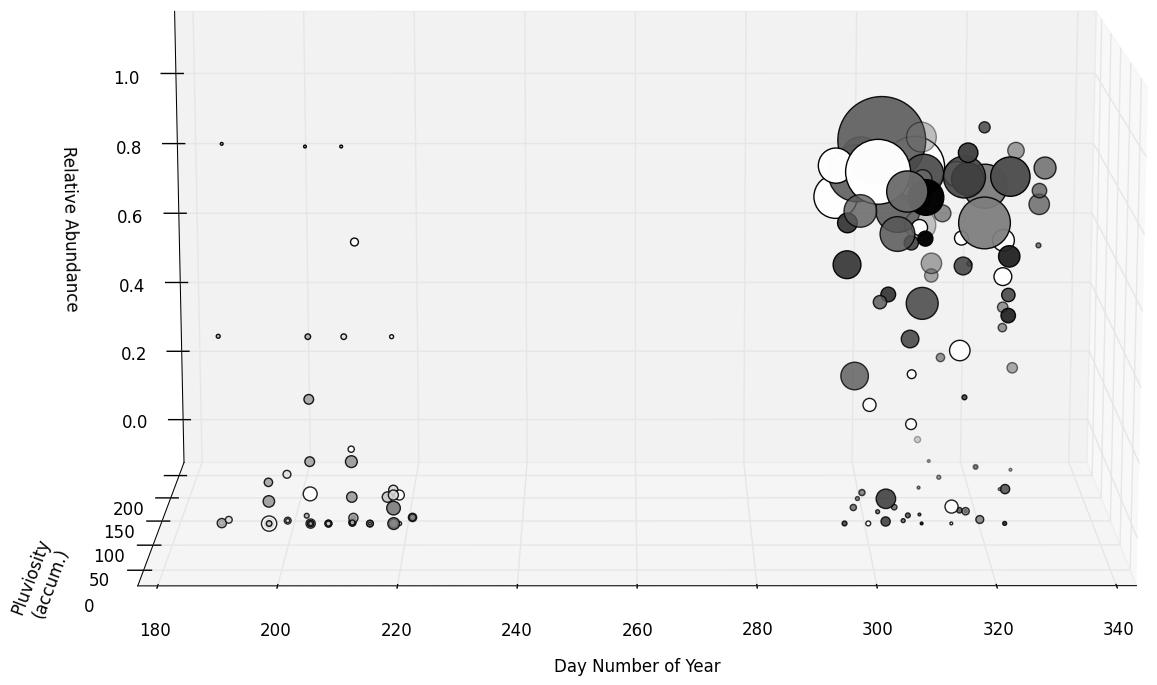
Figure C. Relative abundance of T. polita in relation to total number of Cryptinae along the year against the accumulated precipitation for each sampling event (1 week). Each of the 195 circles corresponds to a sampling event (i.e., total of 3 traps x 1 week) for each of the 3 sampling areas (PF, TSF, LSF). Size of circles corresponds to the total number of cryptines found in all 3 traps of each sampling area (largest circle = 993 specimens). Grey intensity of circles is proportional to the average temperature in each week; white = no records available; otherwise ranging from 20% black (lightest grey, 15.3 ˚C) to fully black (26.9 ˚C). Z-axis: 8-years mean of the cumulative precipitation during the 7-day period of each sampling event. Combined data for all years (2000-2008).
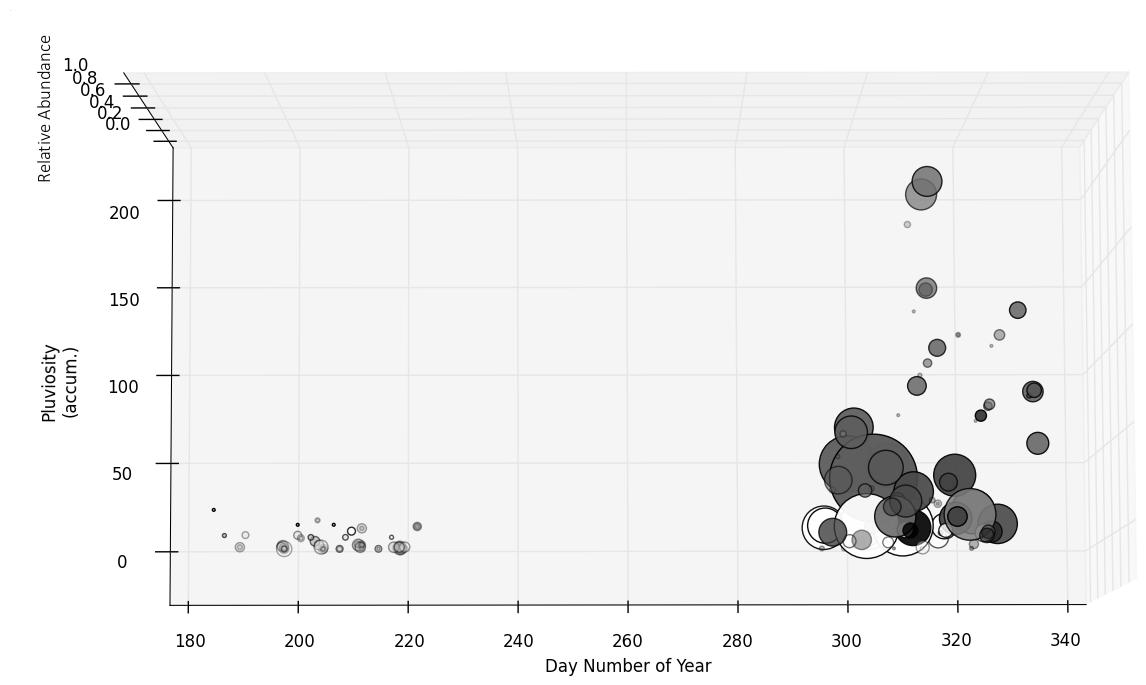
Figure D. Same as Fig. C, top view.
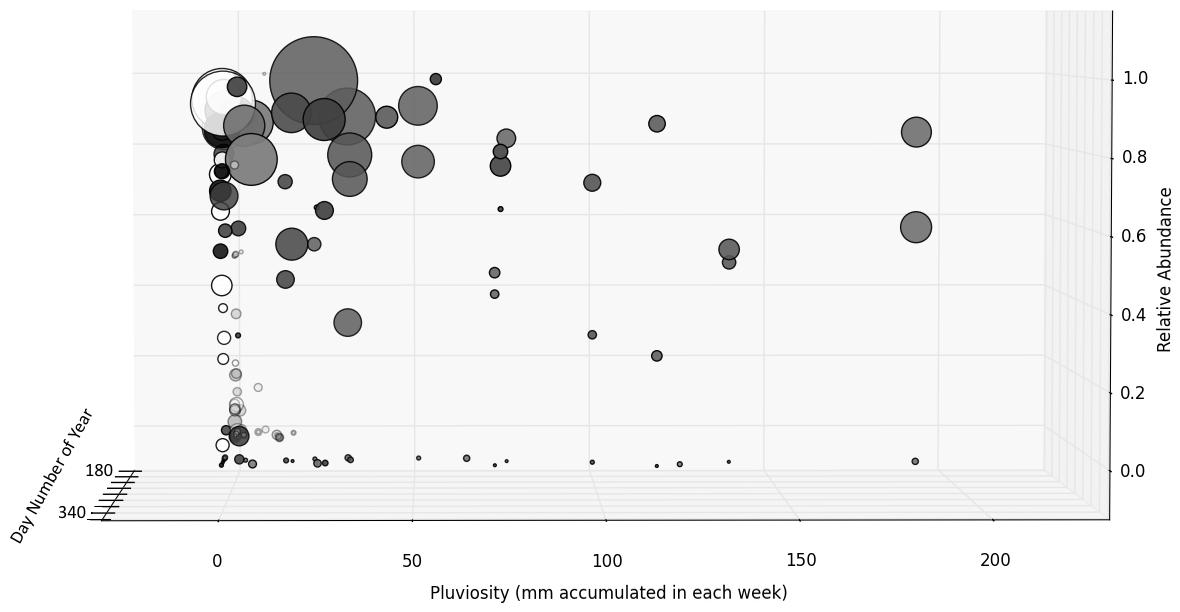
Figure E. Same as Fig. C, but rotated and exhibited precipitation-wise.
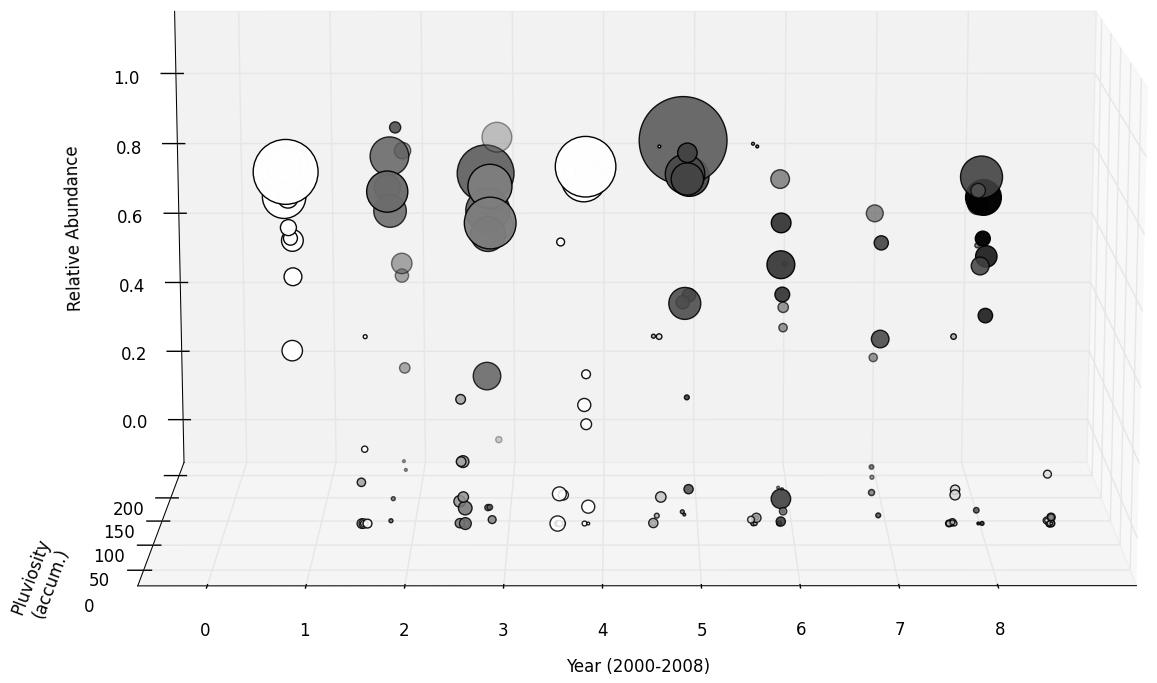
Figure F. As in Fig. C, except that samples are plotted along the year for each separate year (X-axis, 0–8 = 2000–2008).
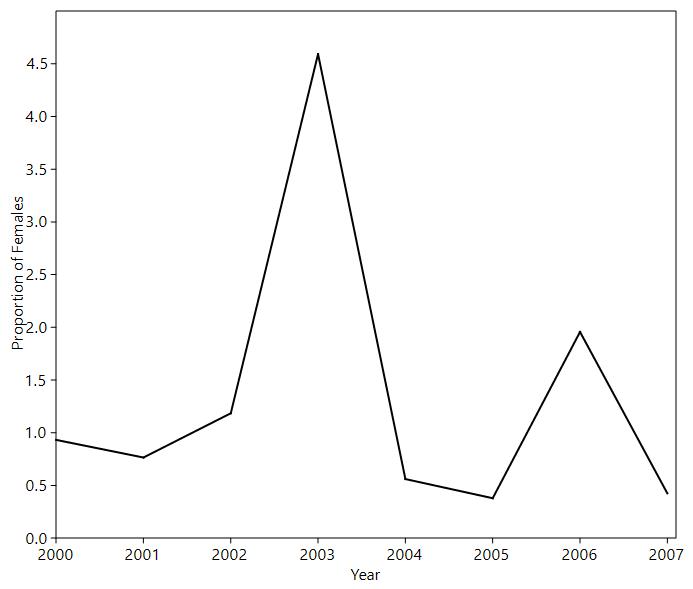
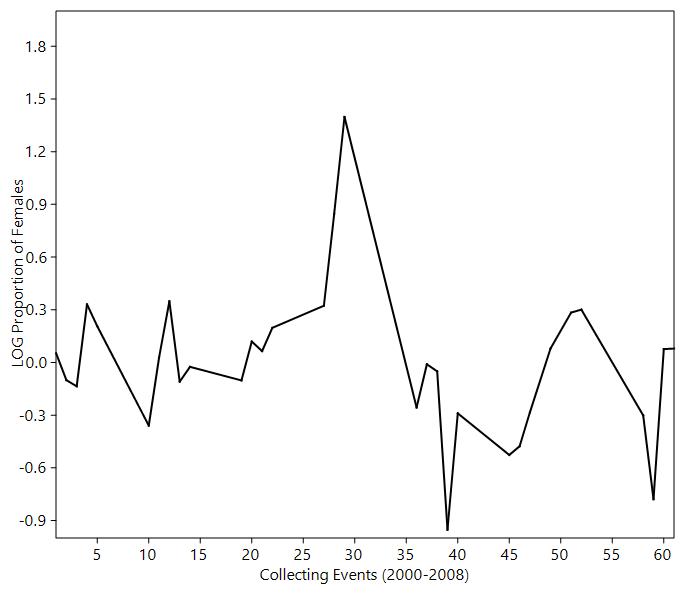
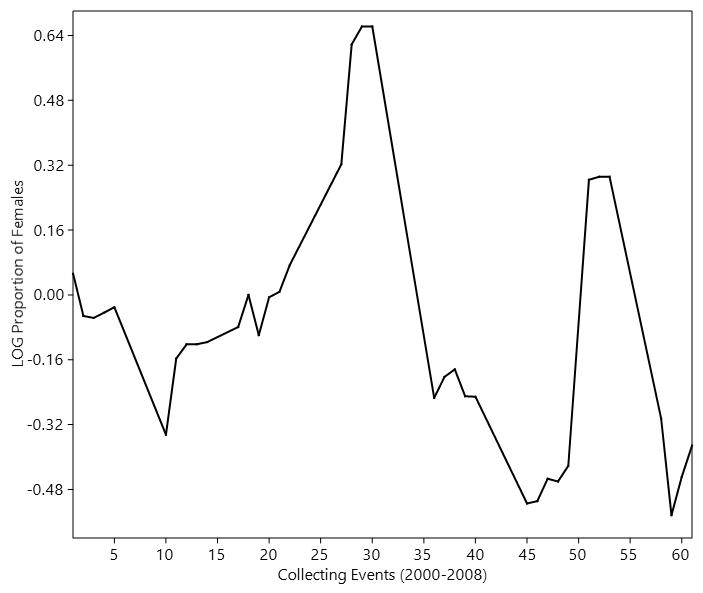
Figure G. Annual fluctuation of the sex ratio for T. polita in the RS. From left to right: 1. Considering the annual totals of males and females (2000-2007); 2. Log transformation of the totals for each collecting event (3 areas x 3 traps x 1 week); 3. Log transformation of the cumulative totals of the collecting events in each year. Missing or zero values replaced with average from neighboring values (4 occurrences for chart 2, and 1 for chart 3).